

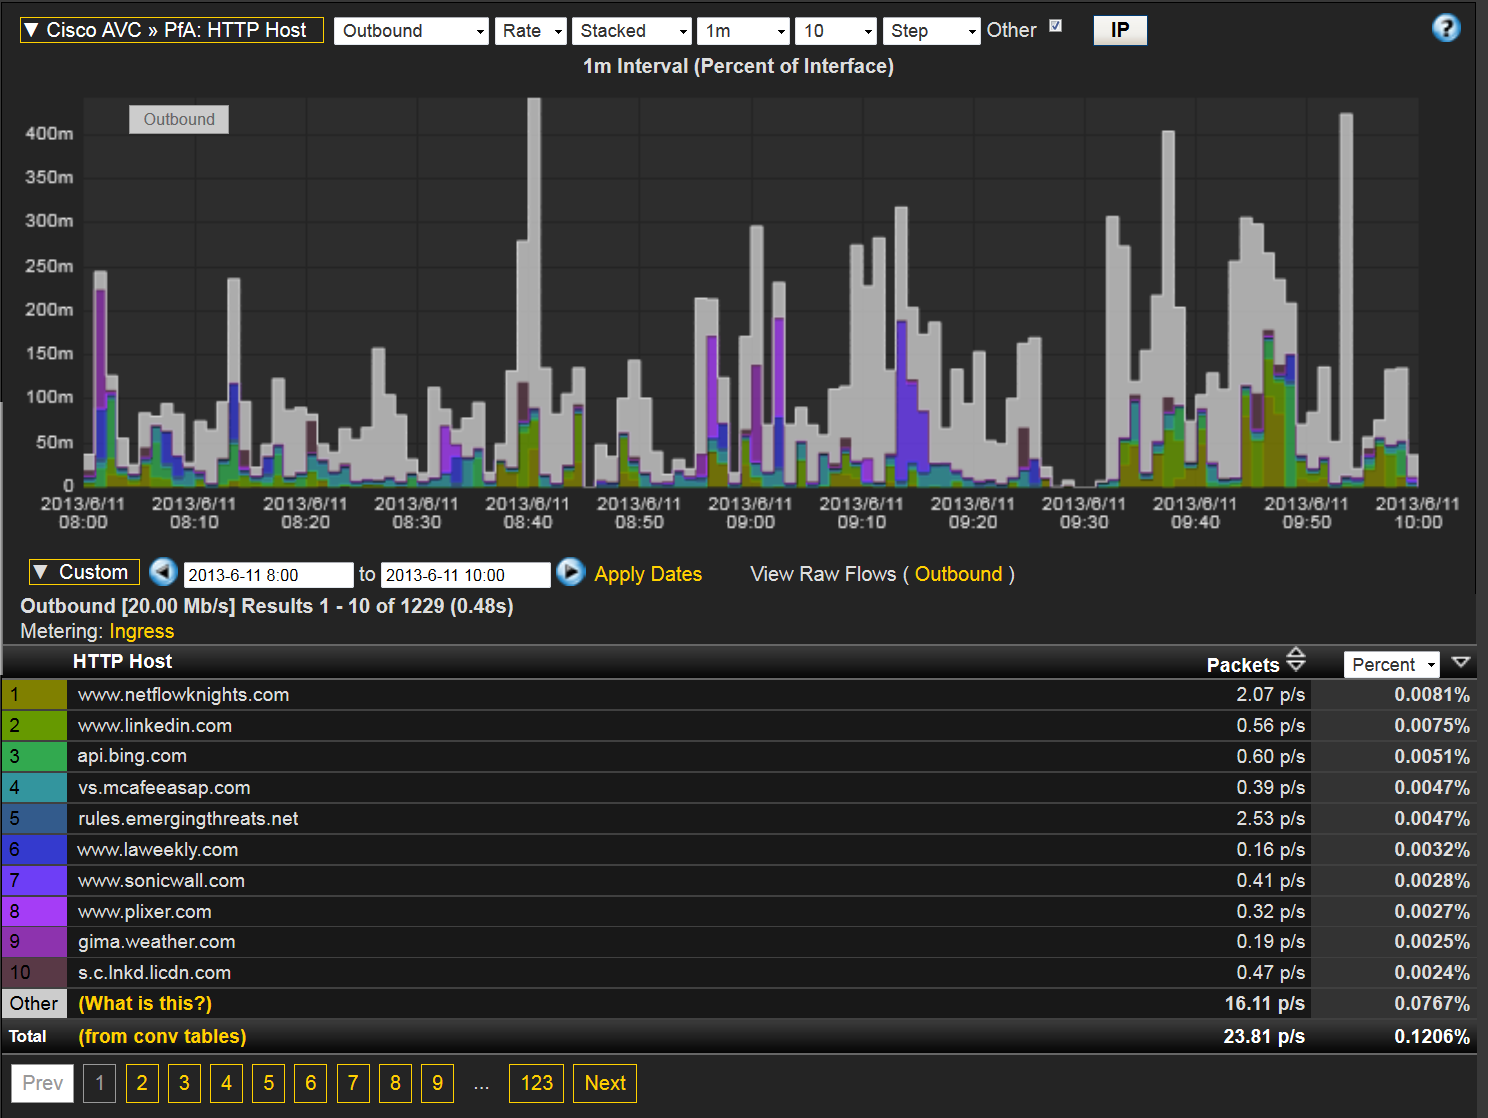
Example 1: Cisco AVC Reporting:
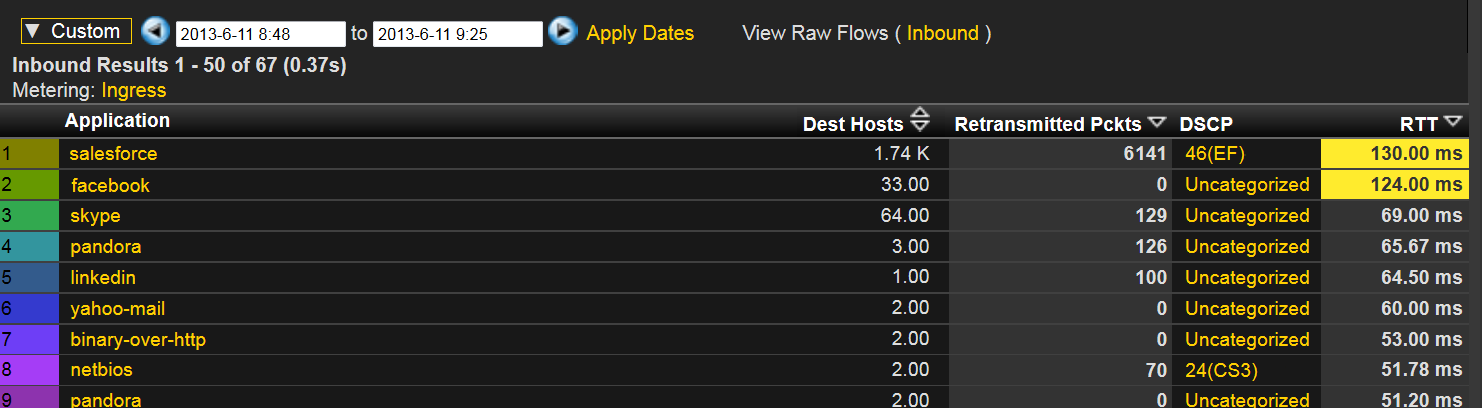
Example 2: Cisco AVC Support
!create ACLs for traffic you want to monitor
access-list 130 permit icmp any any
access-list 135 permit udp any any
access-list 140 permit tcp any any
!create class-maps that will match certain types of traffic to be monitored
class-map match-any realtime
match protocol rtp audio
class-map match-any tcp
match access-group 140
!
!this is a record that is designed to do traffic accounting without calculating
performance metrics.
flow record type performance-monitor general-purpose
match ipv4 protocol
match ipv4 source address
match ipv4 destination address
match transport source-port
match transport destination-port
match interface input
match flow direction
match application name
collect routing next-hop address ipv4
collect ipv4 dscp
collect ipv4 ttl
collect ipv4 source mask
collect ipv4 destination mask
collect transport tcp flags
collect interface output
collect counter bytes
collect counter packets
collect timestamp sys-uptime first
collect timestamp sys-uptime last
!
!This is not used in our configuration. If you want to monitor queue drops, let
me know and I will show you what to add to the config.
flow record type performance-monitor queue-drops
match policy qos queue index
collect policy qos queue drops
!
!This record defines what is to be monitored within RTP
flow record type performance-monitor media-record
match ipv4 protocol
match ipv4 source address
match ipv4 destination address
match transport source-port
match transport destination-port
match transport rtp ssrc
match interface input
collect datalink source-vlan-id
collect routing next-hop address ipv4
collect ipv4 dscp
collect ipv4 ttl
collect transport packets lost counter
collect transport packets lost rate
collect transport event packet-loss counter
collect transport rtp jitter mean
collect transport rtp jitter minimum
collect transport rtp jitter maximum
collect interface output
collect flow direction
collect counter bytes long
collect counter packets
collect timestamp sys-uptime first
collect timestamp sys-uptime last
collect application name
collect application media bytes counter
collect application media packets counter
collect connection initiator
collect connection new-connections
collect transport rtp flow count
collect transport event packet-loss counter min
collect transport event packet-loss counter max
collect transport rtp payload-type
collect transport packets lost rate min
collect transport packets lost rate max
collect transport rtp jitter mean sum
!
!
!
!These are Application Response Time metrics for TCP applications
flow record type performance-monitor conversation-record-with-art
match connection id
collect routing next-hop address ipv4
collect ipv4 dscp
collect ipv4 source address
collect ipv4 destination address
collect transport source-port
collect transport destination-port
collect interface input
collect interface output
collect flow direction
collect flow sampler
collect counter bytes long
collect counter packets long
collect timestamp sys-uptime first
collect timestamp sys-uptime last
collect application name
collect connection initiator
collect connection new-connections
collect application http uri statistics
collect connection delay response to-server sum
collect connection server counter responses
collect connection delay response to-server histogram late
collect connection delay network to-server sum
collect connection delay network to-client sum
collect connection client counter packets retransmitted
collect connection delay network client-to-server sum
collect connection delay application sum
collect connection delay application max
collect connection delay response client-to-server sum
collect connection transaction duration sum
collect connection transaction counter complete
collect connection server counter bytes long
collect connection server counter packets long
collect connection client counter bytes long
collect connection client counter packets long
collect connection client transport port
collect connection server transport port
collect application http host
!
!The destination x.x.x.x is your scrutinizer server
flow exporter export-to-samplicator-ipfix
destination x.x.x.x
source GigabitEthernet3
transport udp 2002
export-protocol ipfix
template data timeout 60
option interface-table
option application-table
option c3pl-class-table
option c3pl-policy-table
option application-attributes
option sub-application-table
option metadata-version-table
!
!Flow monitor definitions below tie together exporter and record and define
how large you would like to make the caches
!again, not used but left as an example in case you want to use it
flow monitor type performance-monitor queue-drops
record queue-drops
exporter export-to-samplicator-ipfix
cache entries 1000
cache timeout synchronized 60
!
!
flow monitor type performance-monitor media-monitor
record media-record
exporter export-to-samplicator-ipfix
cache entries 1000
cache timeout synchronized 60
!
!
flow monitor type performance-monitor general-purpose
record general-purpose
exporter export-to-samplicator-ipfix
!
!
!
flow monitor type performance-monitor performance-monitor-with-art
record conversation-record-with-art
exporter export-to-samplicator-ipfix
cache type normal
cache entries 2000
cache timeout event transaction-end
!
!performance monitor policy map
policy-map type performance-monitor my-policy
parameter default account-on-resolution
class tcp
flow monitor performance-monitor-with-art
class realtime
flow monitor media-monitor
class general-purpose
flow monitor general-purpose
!apply the service policy on BOTH input and output.
interface GigabitEthernet3
service-policy type performance-monitor input my-policy
service-policy type performance-monitor output my-policy
Note: Cisco recently simplify this configuration using Cisco ezPM. It still uses a Flexible NetFlow configuration but, the process is much simpler and still allows you to take your network traffic analysis to the next level!


Leave a comment