By: Josee Loudiadis, Director of Network Intelligence, Alcatel-Lucent
Data and signaling growth are usually good news for network operators, since growth often translates into higher revenues. But when growth is averaged over a month or quarter, the daily highs and lows of network activity are smoothed out. And signaling spikes remain hidden within the averages. These spikes can overwhelm available signaling capacity, which impairs the customer experience, as well as the operator’s reputation.
What happens when a spike occurs? Typically, a CPU Overload alarm appears on various mobile nodes. And the Network Operations Center (NOC) immediately starts praying that the burst is short-lived and doesn’t go over maximum peak-rate capacity. Because when that happens, all consumers are denied service access. Then, the process of identifying the source of the problem begins. This can be arduous, because it often involves applications completely out of NOC control. And the issue can’t be resolved easily without solid network analytics that enables engagement with application and device developers.
That’s the reason signaling information is a crucial part of the Alcatel-Lucent Mobile Apps Rankings report and why LTE World 2014 devotes an entire pre-conference day to the topic. It’s also why this blog offers a closer look at how some real-world disruptive signaling spikes got started — and were finally resolved.
Signaling spikes: The basics
There are three kinds of signaling spikes:
- Microbursts that can be measured in seconds
- Extended bursts that can last minutes to hours
- Suddenly sustained signaling growth where signaling jumps significantly, then continues to increase over weeks and months (for example, Facebook’s 60% jump on Nov 2012)
The following signaling spikes were observed with the Alcatel-Lucent Wireless Network Guardian (WNG) on multi-vendor networks. These examples demonstrate the impact and resolution of signaling jumps ranging from 36% to 92%.
Microbursts 1: Samsung, Google and a pre-loaded app
As shown in Figure 1, all the serving gateways (SGW) in this example experienced short signaling spikes, six times per day (at 00:00, 1:30 a.m., 6:30 a.m., 8:00 a.m., 12:30 p.m. and 6:30 p.m.). The spikes started with a barely noticeable 8% jump in signaling and grew steadily to the 44% jump that’s clearly visible one year later.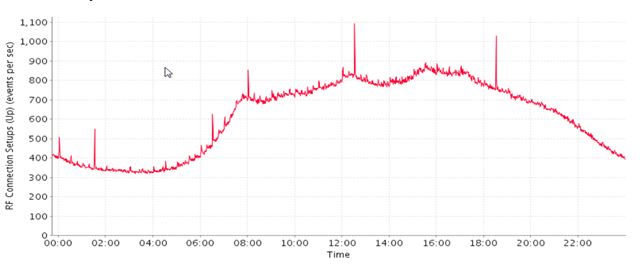
At last, one spike became too much for the SGW. Some of its blades were brought down by the overload, which caused a signaling disruption and partial service outage. Traffic was diverted to a higher-capacity backup SGW, until the issue could be isolated and resolved.
Using the Alcatel-Lucent WNG for analysis, the problem was isolated to Samsung S4 devices with Android versions 4.2 and 4.3 — when traffic originated from these devices and tried to reach Google.com. Once Samsung had that information, they were able to determine that a pre-loaded app on that device generated the spikes. This app connected with a Google API to determine the user’s location, so local news could be delivered to the consumer.
In Android version 4.4, the app had already been removed. For versions 4.2 and 4.3, the operator initially believed they could simply remove the offending app as a way to address the signaling spikes. However, pre-loaded apps are difficult to remove. So instead, multiple updates have been pushed to test devices, in attempts to iteratively eliminate the problem.
Extended bursts: Viber outage
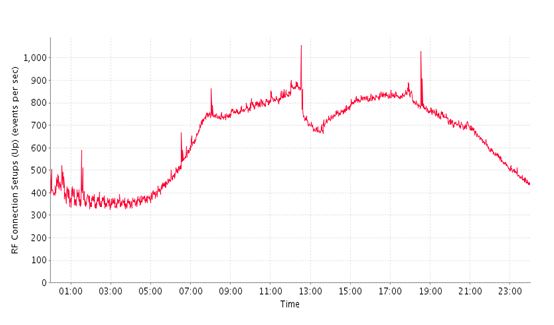
One day in April, CPU overload alarms reported that Radio Network Controllers (RNCs) were flooded with requests. The signaling spike pattern shown in Figure 3 was matched to one app: Viber. Further investigation into Viber’s flows showed that Viber servers were no longer responding. But here’s what wasn’t clear: Why would this app outage generate such a load on signaling resources? The answer lies in how Viber handled the call failures. The app loaded on mobile devices tried repeatedly to connect with the Viber server, and that created a growing wave of signaling as more and more users kept trying to connect.
The impact of this outage varied across networks. Where only a few consumers used the Viber app, operators might not have noticed. Where there was a high proportion of Viber users, they experienced a spike. Each network’s ability to tolerate the spike depended on whether it had enough peak hour signaling capacity. The timing of the Viber outage also produced different results in different geographical locations. That is, an outage during the network’s peak time — and the heaviest Viber usage — had a heavier impact.
Microbursts 2: Microsoft Exchange and iOS
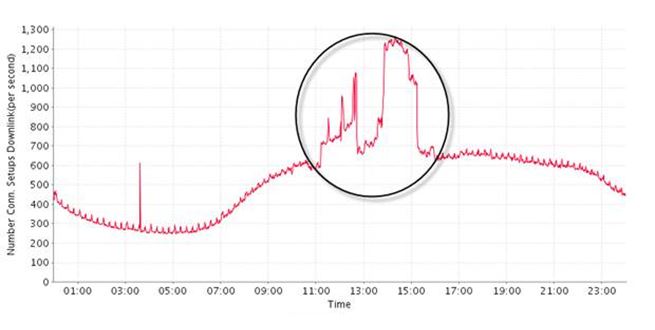
This case illustrates another short-term outage where a signaling spike exceeded signaling capacity on a daily basis. As shown in Figure 4, a 36% signaling jump occurred every day at midnight, but the reason for the spike remained mysterious. The Alcatel-Lucent WNG narrowed down the issue: The signaling was initiated when devices tried to reach the Microsoft Exchange server. Lasting less than 1 second, this exchange only involved iPhone devices, and it occurred most often with iOS version 6.1. After obtaining this information, network operators were able to contact Apple and identify the root cause. Then a fix was implemented in a later iOS version update.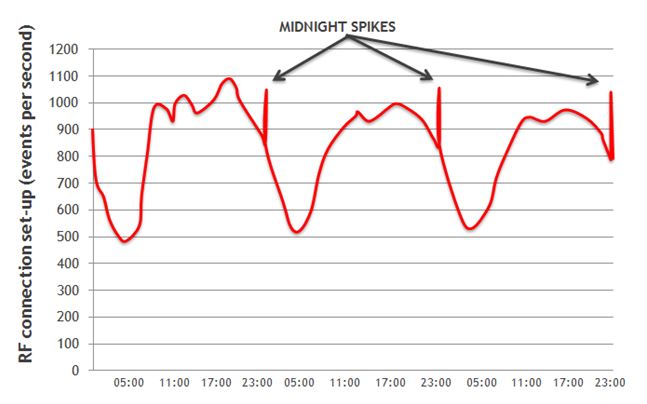
These real-world examples of signaling spikes clearly demonstrate that signaling design is an important aspect of the customer experience. More specifically, they bring home three important points: First, a robust and well-dimensioned signaling plane that can absorb sudden spikes is essential. In addition, our device and app ecosystem needs to consider how network signaling interactions can be optimized, when designing products. And finally, a strong network analytics solution is also a necessity for tracking the signaling of each application, detecting signaling anomalies and identifying root causes as quickly as possible.
The Alcatel-Lucent Analytics Beat studies examine a representative cross-section of mobile data customers using the Alcatel-Lucent Wireless Network Guardian, and they are made possible by the voluntary participation of our customers. Collectively, these customers provide mobile service to millions of subscribers worldwide.
Follow Josee on Twitter @joseeloudiadis