By: Patrick McCabe, Senior Marketing Manager, Alcatel-Lucent
We know from our own experience and from anecdotal evidence that mobile devices are proliferating and that mobile data usage is growing rapidly. This tremendous change necessitates change to the underlying network, too. But in order to make the best choices in terms of infrastructure investment, mobile service providers must have accurate data showing what devices are being used and which consume the most data and signaling resources.
Alcatel-Lucent recently compiled the result of actual data collected by its Motive® Wireless Network Guardian. The data, from over 30 million subscribers, is aggregated from live 3G customer networks across most regions of the world, and represents total daily data usage of over 1 petabyte.
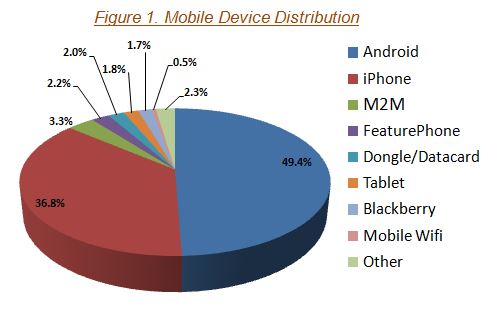
Figure 1 shows that Android and iPhone devices make up more than 86% of the total connected devices in the global composite network that was analyzed – a testament to how pervasive smartphones have become. This is consistent with the findings from other industry reports. This may be a harbinger of things to come with respect to consumers’ voracious appetite for more and more features, capabilities and personalized experiences.
To accurately measure the overall impact on the network, it is important to consider just how much data is being used and overall signaling activity. Data usage drives the service provider’s bandwidth-related capital expenditures and the consumer’s data usage fees. Signaling activity measures the amount of network-to-device bi-directional exchanges needed to manage a radio connection to a mobile device. Signaling uses spectral, hardware, and processing resources in the service provider’s network and is a significant cause of battery depletion on a mobile device.
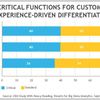
Figure 2 shows the percentage share of both data usage and signaling activity for each device category in the network.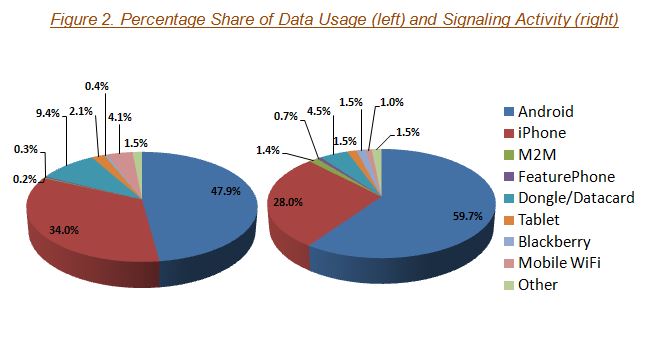
Androids consume almost 50% of the total network data usage and, combined with the iPhone category, account for more than 80% of the total network data usage. When looking at signaling activity, Androids and iPhones also dominate with Androids representing an incredible 59.7% percentage share of signaling activity. Combined with the iPhone category, they account for almost 90% of the total signaling activity. It is also clear that Androids have a larger impact on the network than iPhones do as its share of signaling and data usage are 59.7% and 47.9%, respectively, when compared to 28% and 34%, respectively for iPhones. This difference represents a 31.7% higher share of signaling and a 13.9% higher share of data usage for the Android category over the iPhone category. This is due in large part to the fact that worldwide Androids are more popular than iPhones, but also because, individually and on average, Androids signal more than iPhones.
Despite only a 2% subscriber share, the Dongle/Datacard category shows a 9.4% share of data usage. This may be explained by understanding that these devices are typically attached to a PC or laptop which has a larger screen and is not as prone to mobility as are smartphones. As such, these devices may be consuming a proportionally larger amount of data usage than other categories by streaming video, downloading various videos, playing online video games, downloading/uploading high-res pictures, etc.
The Mobile Wi-Fi category shows a similar trend. With only 0.5% of the subscriber share, this category still manages to consume 4.1% share of data usage. This represents the largest data usage-to-subscriber share ratio across all device categories due to each Mobile Wi-Fi device having many mobile Wi-Fi devices aggregated behind it, collectively generating a large amount of data for a relatively small percentage of subscriber share.
The Machine to Machine (M2M) category represents non-personal devices that fall under commercial use for monitoring and control purposes. M2M devices signal much more actively when compared to their data usage. In this global composite network, M2M consumes 0.2% share of data usage while generating 1.4% share of signaling activity. Although tiny in terms of overall popularity, the M2M category represents the largest ratio between signaling and data usage, which means these devices are signaling a lot more than they are sending data. Some M2M applications, such as a home smartmeter, frequently establish mobile connections generating multiple signaling messages to establish network connectivity, yet have small amounts of data to send each time.
The growth rate of mobile data is staggering and continues to increase at an incredible rate as mobile devices have evolved from being tools for personal communication into being high performing, multi-media platforms. Live-streaming high-definition (HD) video, surfing the web, engaging in social media, on-line gaming and secure banking are just a few of the types of applications used daily on an ever-growing number of connected devices worldwide.
Given that the total number of active wireless connected devices is expected to grow from 13 billion in 2013 to more than 40.9 billion in 2020, it’s critical that mobile service providers, as well as mobile device manufacturers, understand the impact on the mobile network. Which devices consume the most signaling resources? Which use the most data? Answers to questions such as these are essential if service providers are to plan and grow their network efficiently, and for device manufacturers to enhance their designs.
This blog touched on the overall network impact that mobile devices have in the network. In upcoming blogs, I’ll take a closer look at the role device behavior plays in the network. Questions such as how much average daily data usage and signaling activity is associated to each device independent of popularity? What is the most signaling efficient device in the market? How does LTE change the network impact and behavior of devices in the network? Are there regional variations to these findings? What are the top signaling applications behind Androids and iPhones?
Join us for a live webinar on June 17 where our experts will discuss the research results in detail.
Author
Patrick McCabe holds a senior marketing management role in Alcatel-Lucent and is currently responsible for promoting products and solutions for Network Intelligence and Analytics. Patrick has held a number of support, sales, and marketing roles during his 20 years in the telecommunications industry. He was educated at St Francis Xavier University and Technical University of Nova Scotia (DalTech), and holds Bachelor and Masters degrees in Engineering.