Key Takeaways:
• AI search rankings move day to day across engines, not just month to month
• In our three-week daily track for “Best marketing automation software,” HubSpot stayed consistently on top while competitors’ ranks and scores shifted
• The biggest driver of volatility came from engine-specific differences (notably Perplexity early on), reinforcing why multi-engine monitoring matters
• Point-in-time screenshots can be misleading; continuous measurement is the only way to understand true exposure and trend direction
• FusionScore.ai (built to track and improve AI search with both a score and rank) shows how small daily swings compound into meaningful visibility changes over time
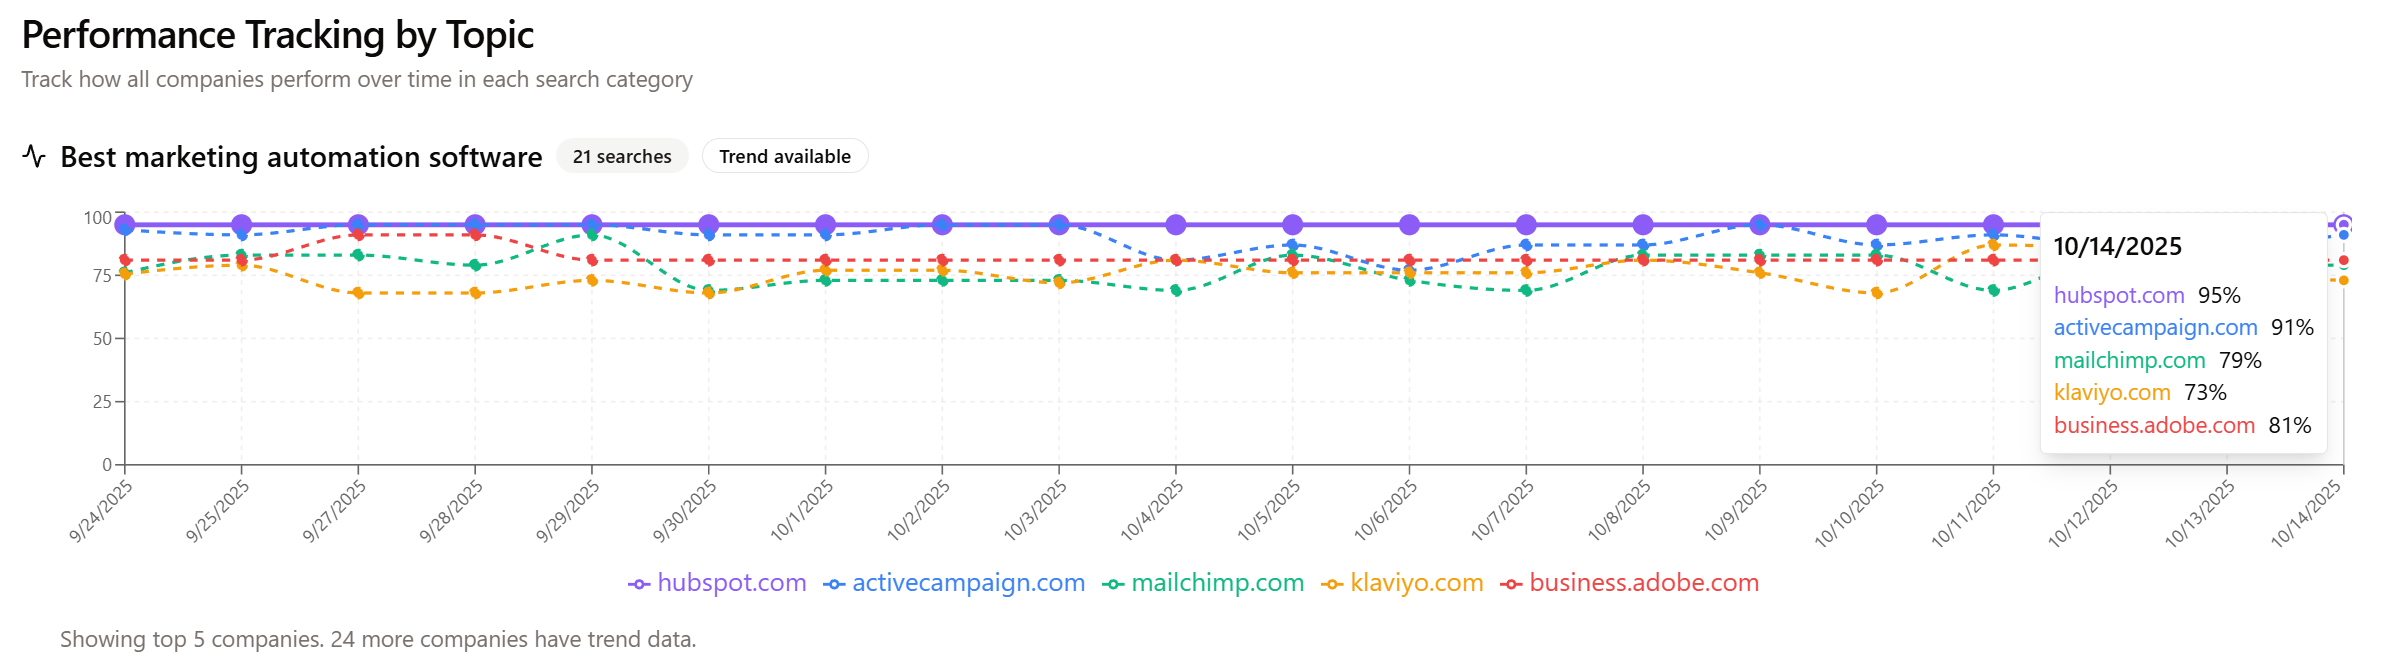
AI search doesn’t behave like static web results. Answers are generated, reweighted, and contextual, and the underlying models and retrieval strategies change frequently. Over the last three weeks, we ran a daily tracked query for “Best marketing automation software” and compared the combined and per-engine results across ChatGPT, Gemini, Claude, Perplexity, and Copilot using the FusionScore.ai reporting workflow. The goal was simple: quantify how much rankings and scores actually fluctuate, and separate stable leaders from engines and brands that move around.
Local search via AI fluctuates even more and acts totally differently than static searches such as this one.
First, the anchor: HubSpot was the consistent winner across the period we analyzed. In the Sept. 27 run, HubSpot led most engines but appeared second on Perplexity; by Oct. 4 and again on Oct. 14, HubSpot held the top spot across all five engines, indicating a shift in Perplexity’s output toward the consensus pattern seen elsewhere.
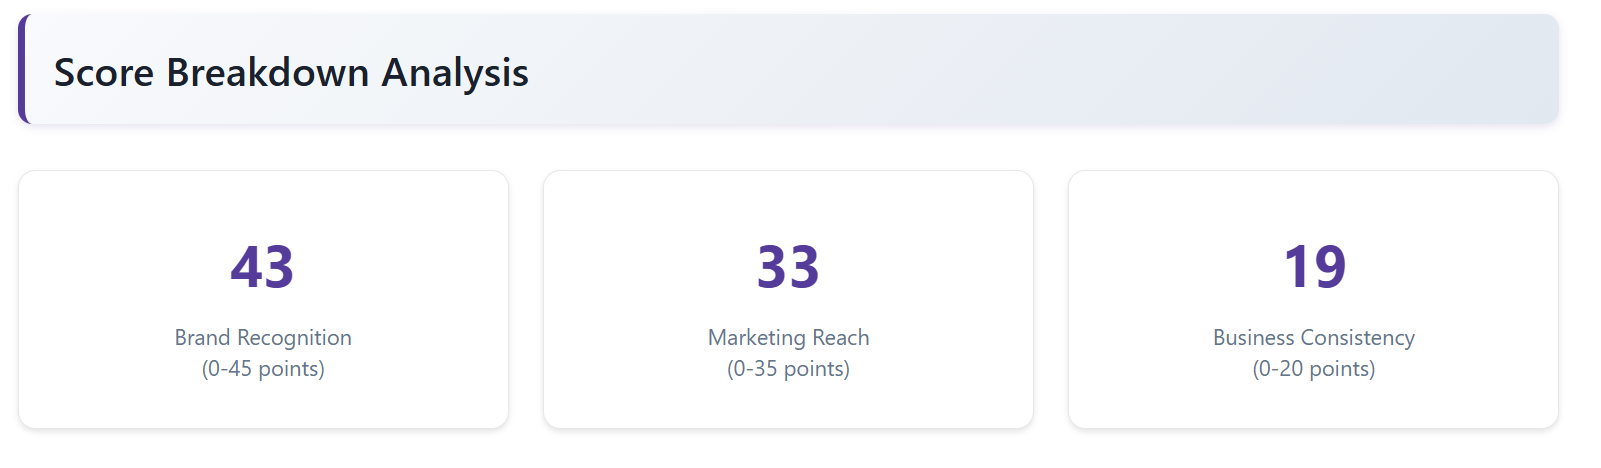
Beyond the winner, variation showed up in two places: engine-to-engine dispersion on the same day and day-to-day movement within each engine. The combined multi-engine table on one of the reports shows how tight the top tier looked on that particular snapshot: HubSpot and ActiveCampaign both posted FusionScores in the mid-90s, Adobe and Salesforce clustered in the low-90s, while Mailchimp dropped into the low-80s and Klaviyo into the high-60s for that run. That ordering matched the “leader plus tight chasing pack” pattern we saw repeatedly on the timeline, even as individual company scores wiggled.
Where did the fluctuations mostly come from? The per-engine breakouts point to engine-specific dynamics:
• Perplexity’s early divergence. On 9/27, Perplexity placed HubSpot at #2 while the other four engines ranked it #1. By 10/4 and 10/14, Perplexity converged to #1 as well. That single-engine shift materially changed the combined average position for HubSpot between the first and later samples.
• Tight clustering among the next three brands. ActiveCampaign, Adobe (Marketo), and Salesforce (Pardot) traded places in several engine lists, and their combined scores compressed into a narrow band in the low- to mid-90s in at least one sample, which is exactly the type of “close call” that can produce visible day-to-day rank flips even if underlying relevance is effectively tied.
• Mid-pack volatility. Mailchimp and Klaviyo exhibited larger score deltas relative to the top four, with Klaviyo appearing in fewer engine top results in one report. Lower frequency of appearance (i.e., showing up on fewer engines on a given day) increases volatility in the combined rank because one engine’s movement has outsized impact.
What explains these movements? A few practical factors we see when measuring AI search in production:
- Engine updates and retrieval freshness
Large models and their retrieval layers change frequently. Even small shifts in prompt scaffolding, index freshness, or grounding sources can move one brand up or down for a given query. The Perplexity convergence noted above is a textbook example: once Perplexity aligned with the consensus signal, the combined score stabilized at the top. - Ambiguity and tie-breakers
When several vendors are “close enough,” different engines will resolve ties differently. That’s why ActiveCampaign, Adobe, and Salesforce frequently swapped positions in the 2–4 range while their composite scores stayed very tight. - Coverage vs. position
Appearing in more engines matters. Brands that show up on all five engines—even if not #1 everywhere—tend to maintain higher FusionScores than brands that peak on one or two engines but drop out elsewhere. In one sample, Klaviyo and Sendinblue appeared on fewer engines, which compressed their overall scores despite decent placements where they did appear.
Why continuous tracking beats one-off checks
A point-in-time screenshot can be an outlier. If we had only looked on Sept. 27, we would have concluded that Perplexity “disagrees” with other engines about the leader; a week later that was no longer true. Conversely, relying on a single “good day” can overstate your durable visibility. The three-week daily view shows a steadier story: HubSpot remains the benchmark, while the next group jostles within a narrow band, and several mid-pack players oscillate more due to partial engine coverage and sensitivity to small prompt or retrieval changes.
How to operationalize this
• Track the same query every day across all five engines. The day-to-day line pattern reveals whether you’re stable, trending, or spiky.
• Separate “coverage” (how many engines list you) from “position” (how high you appear). Improving coverage usually reduces volatility first; improving position compounds gains.
• Watch for engine inflection points. If one engine suddenly diverges (as Perplexity did early), investigate content freshness, citations the engine prefers, and answer formats that engine rewards.
• Treat rank ties as a signal, not noise. If three brands keep swapping between #2 and #3, the right move is targeted differentiation, not blanket content.
• Align teams to a combined score and per-engine drill-downs. The combined FusionScore tells you overall exposure; the engine breakouts tell you where to act next.
About the methodology
We used the FusionScore.ai tracked search workflow to run the same topic—“Best marketing automation software”—daily across ChatGPT, Gemini, Claude, Perplexity, and Copilot, then compared combined rankings and per-engine placements on 9/27, 10/4, and 10/14. HubSpot led consistently, with the notable Perplexity shift between 9/27 and the two October samples. FusionScore.ai is purpose-built to track and improve AI search using both a score and a rank across multiple engines, helping teams translate daily movements into an actionable plan.
Aside from his role as CEO of TMC and chairman of ITEXPO #TECHSUPERSHOW Feb 10-12, 2026, Rich Tehrani is CEO of RT Advisors and a Registered Representative (investment banker) with and offering securities through Four Points Capital Partners LLC (Four Points) (Member FINRA/SIPC). He handles capital/debt raises as well as M&A. RT Advisors is not owned by Four Points.
The above is not an endorsement or recommendation to buy/sell any security or sector mentioned. No companies mentioned above are current or past clients of RT Advisors. Tehrani is the founder of FusionScore.ai.
The views and opinions expressed above are those of the participants. While believed to be reliable, the information has not been independently verified for accuracy. Any broad, general statements made herein are provided for context only and should not be construed as exhaustive or universally applicable.
Portions of this article may have been developed with the assistance of artificial intelligence, which may have contributed to ideation, content generation, factual review, or editing